Coincidence Search for IceCube Alerts Clustering
based on Monte-Carlo scramblings
Motivation
Short timescale transient neutrino sources can be identified by coincidence analysis: No matter the overall population properties - luminosity function, local rate density, and form of cosmic evolution - any operating facility must eventually trigger on a doublet or higher-multiplicity multiplet with high stand-alone statistical significance. By the same token, the absence of (e.g.) bona fide triplet events on the <1000 s timescale also conveys information ( IceCube Collaboration 2017): It can be used to set a bound on the frequency of short-timescale neutrino transients, and together with our understanding of the total rate of astrophysical neutrinos, provides a bound on the fraction of astrophysical neutrinos that originate in any transient source population.
A similar argument applies to the case of persistent neutrino sources: Eventual discovery of the highest-flux source(s) via conventional point-source search is assured. The chief challenge in applying this approach to the IceCube track events sample is the relatively high background (low signal to noise).
Enter the Alerts Catalog: Given the relatively high purity and compact localizations of these events, we can anticipate multiple neutrino detections from the one or few brightest (and/or hardest-spectrum) persistent neutrino sources to eventually appear in the catalog. Alternatively, if no significant doublet or multiplet collection of alert events is identified, we can set a limit on the number of sources contributing to the alerts sample, and this will in turn constrain the fraction of astrophysical neutrinos that can be due to persistent sources.
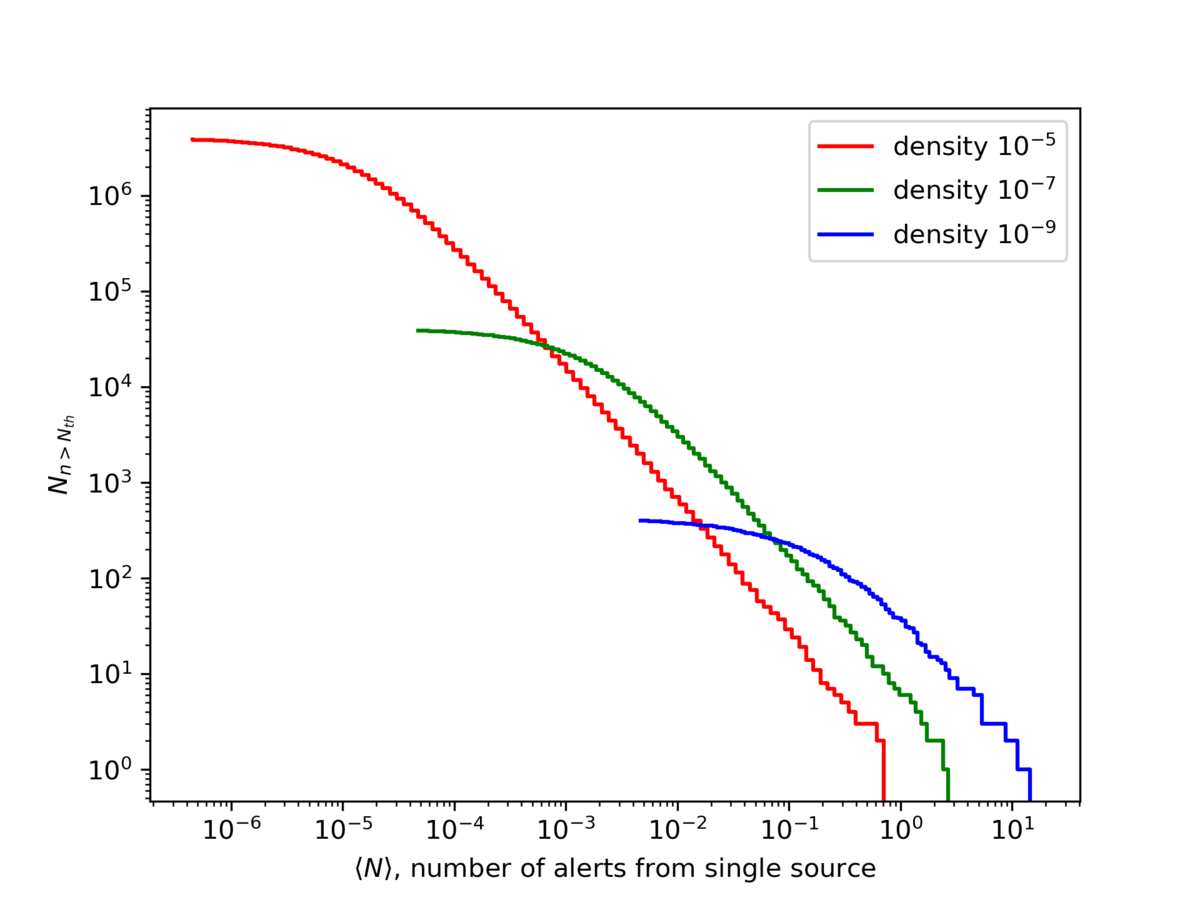
Indeed, our preliminary explorations with Firesong (see below) indicate that the absence of alert doublets / multiplets primarily constrains the total number of neutrino sources (above some fiducial threshold flux), and is relatively independent of other properties of the neutrino source population.
The present analysis therefore aims to either identify evidence of doublet/multiplet structures in the alerts catalog, or set a lower bound on the number of neutrino sources contributing to the alerts.

Proposed Analysis
We propose a statistical search for coincident alerts from within the Alerts V2 Catalog. There will be two search modes, allowing for two discovery scenarios. Both search modes will be applied to the Alerts V2 summed map of event probabilities (weighted by signalness), with significance evaluated by comparison to RA-scrambled versions of the catalog.
- Maximum overlap of two pairs
- Excess of probability concentration for the true map overall, via Gini coefficient.
The absence of any significant excess from these analyses will be used to set a limit on the total number of persistent neutrino sources contributing to the astrophysical neutrino flux.
Initial preparatory studies suggest the total number of sources (density of sources within the cosmic horizon) is the most predictive parameter for doublet and other multiplet coincidences within a sample like the Alerts V2 sample. Changing other parameters, including the source luminosity function and the nature of any cosmic evolution, has relatively little effect on the expectations for alert coincidences.
Data and Methodology
Dataset
The IceCat-1 data is Healpix in FITS format with nside = 1024. The pixel value on the map represents the LLH value(\(-2\log(\mathcal{L})\)). We first convert the LLH value to probability by normalizing it to unity. We also consider the signalness \(p_{sig}\) of each event and multiply it with the probability, getting the probability distribution of each cosmic alert event.
Choice of DEC range
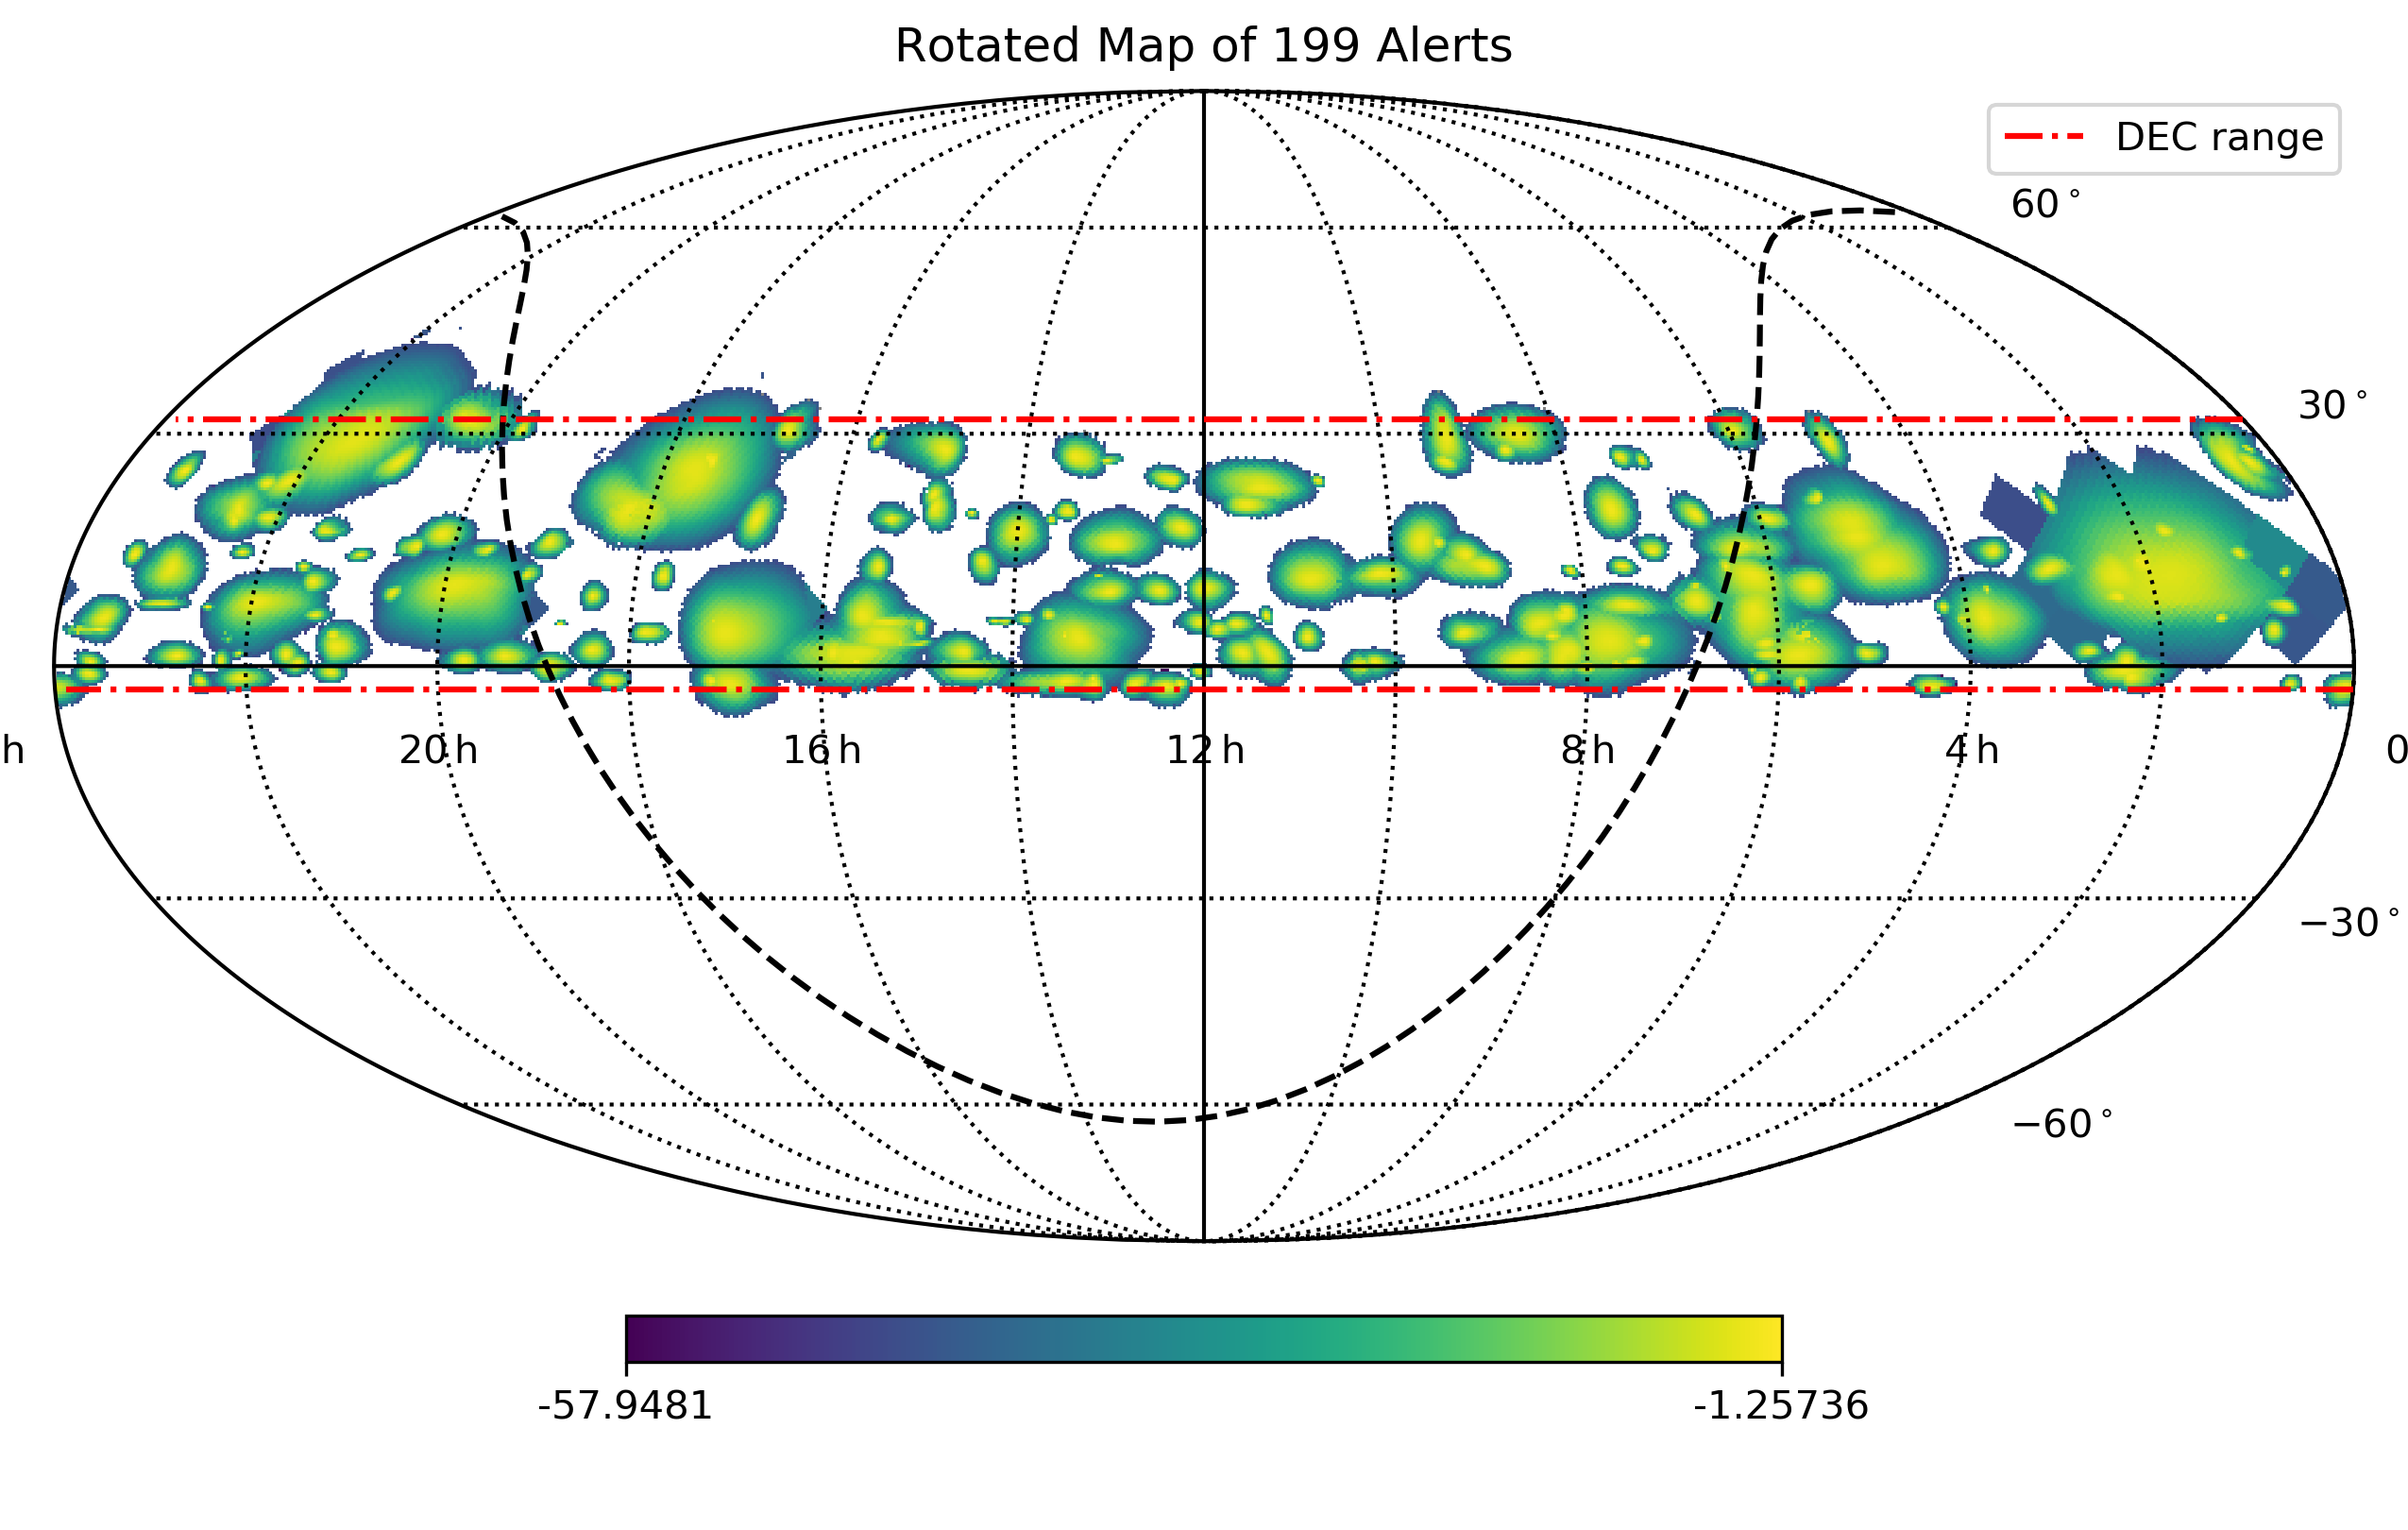
We choose 199 alerts within DEC range (-3,32) out of total 276 alert events from from IceCat-1, in order to have relative high purity of cosmic events.
Statistic
We adopt the inner product of spatial distributions of two alerts as the pairing rate statistic to describe their overlapping. Given the probability distribution (with consideration of the signalness) \(p_i(x), p_j(x)\) for each pixel, where \(i,j\) represent two alerts, we regard the two alerts as independent. Then their joint probability is simply \(p_{ij} = p_i(x) p_j(x)\). Since we don’t know the exact position of the source, we integrate over the overlapping area of two alerts.
\[\mathrm{PR} = \int_\mathcal{S}p_i(a)p_j(a)\mathrm{d}a = \sum_{k}\frac{p_i(k)p_j(k)}{A_k^2} A_k\]where S is the overlapping area of two alerts’ distribution, k represents pixel id on the discrete sky map, and \(A_k\) is the pixel area. To make probability independent upon pixel size, we divide the discrete probability \(p(k)\) by \(A_k\). Note that in order to keep the probability normalized, i.e. \(\sum_ip_i = p_sig\), the Euclidean length of the map vector is not normalized, i.e. \(\sum_i p_i^2 \neq 1\) . Thus the inner product is pixel dependent, and we need to manually divide each \(p_i\) with pixel area.
Gini Coefficient
After summing up all alerts, we have a sky map of cumulative probability by all 199 alerts. We further compute Gini coefficient of the map. The Gini coefficient is defined by
\[\frac{\sum_i\sum_j |x_i-x_j|}{2n\sum_ix_i}\], where i and j represent the pixel index, x is the value of each pixel, and n is the total number of pixels. Since most pixels on the sky map have value 0, we are not interested in them, so we simply calculate the Gini coefficient for all pixels with positive value.
The Gini coefficient reflects whether few pixel points has higher probability contributed by multiple alert events. Since alerts overlap on few pixels, the Gini coefficient is generally very close to 1. If the alerts come from neutrino sources, different alerts tend to cluster around the source, and leave more pixels zero. The pairing rate statistic describes the overlapping of two local alerts, while Gini coefficient can detect the global clustering behavior of alerts. If the alerts are uniformly distributed, the gini coefficient would be smaller than if alerts are clustered around sources.
Scrambling Approach
Since the alerts are declination-dependent, we generate pseudo-experiments by randomizing the right ascension of each alert. After rotating for a random angle, the sky map is shown in the fig below.

On that plot, we select every possible pair of alerts and calculate their inner product. For each scrambling, we record the maximum of the PR value. Then we have the PR distribution under null hypothesis \(H_0\), i.e. all alerts are just random fluctuation and no multiplets are associated to singe neutrino source.
Pairing Rate (PR) Statistic Distribution of Signal Hypothesis and Bayesian approach
The signal hypothesis (\(H_1\)) is that two (or n) alerts are correlated and their distribution overlap. We further perform Monte Carlo to find PR distribution of signal hypothesis by randomly sampling pixels of each alert based on its probability distribution and rotate the map accordingly to align these two points together. Then we calculate the PR value of the doublet. After getting the pdf of \(H_0\) and \(H_1\) and the unblinded \(\mathrm{PR}_{max}\), we can get the Bayesian likelihood ratio of the two hypotheses.
Preliminary Results
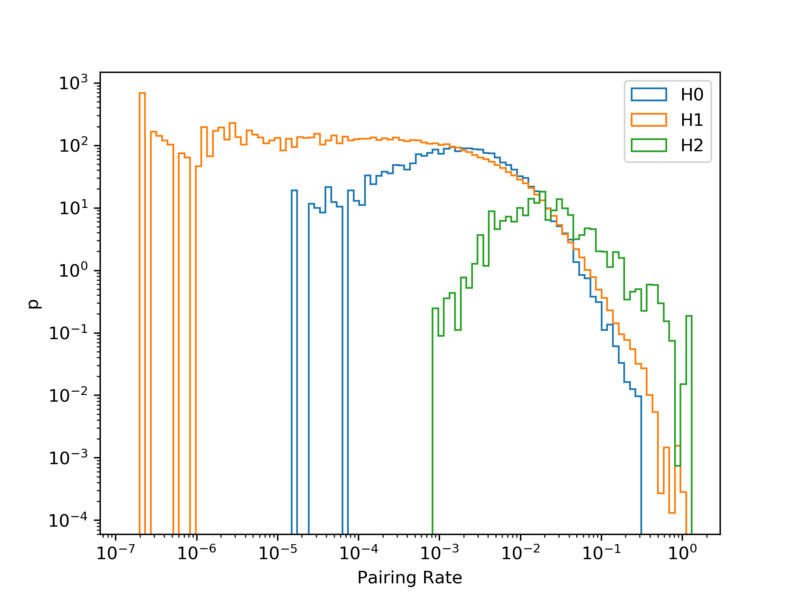
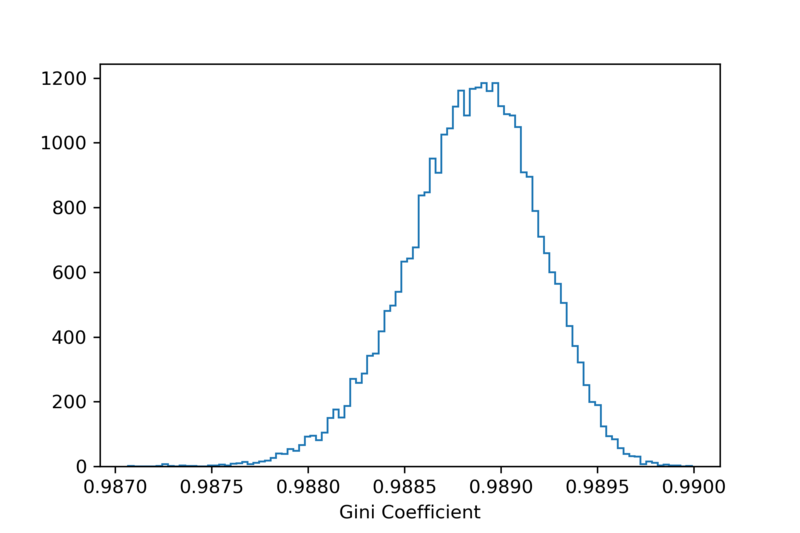
We performed 20400 scrambles of alerts at (-3,32) in DEC, and 10,000 pseudo-simulation of multiplets in each case with n = 2,3,4. the distribution is shown below.


Left: Distribution of maximum pairing rate under null hypothesis H0 (Blue) and signal hypothesis (orange and green). The PR distribution is under signal hypothesis of 2 correlated alerts (1 pair, H1) and 3 correlated alerts (3 pairs, H2); The maximum PR distribution of null hypothesis is from 20400 scrambles
Right: Gini coefficinet distribution over 20400 scrambles. The coefficient is very close to 1, since we only select the alerts between (-3,32) in DEC, and most of the pixels in the sky have value 0.
(This post is originally contributed to IceCube Wiki)